
Stock Market: Is the level currently high? Is it low? How to know?
Updated: May 10
A common question asked by many investors: Is it a good time to invest now in the stock market? Well, if you are investing through SIP, then purchase cost averaging works in your favor and you do not have to bother much about market timing, especially for long-term goals. However, even if you are an SIP investor, if the timing is determined as favorable, you may want to top-up your SIP aggressively based on the opportunity.
Determining whether the timing is favorable or not is a lot more useful to someone who has some spare cash or a windfall gain (e.g. annual bonus, proceeds from real estate sale, ESOP sale, PPF a/c closure, FD redemption, etc.) and is considering making a one-time lumpsum investment. Depending on how favorable the market level currently is, one can decide whether the entire lumpsum can be invested at one go or is better deployed in stages monthly via an STP (Systematic Transfer Plan) from a Debt fund / Arbitrage fund to an Equity Fund. So now, the important question is how do we determine whether the current market level is favorable or not?
There are many metrics available to determine the current valuation of the market level. Some of the valuation metrics include the Index percentage price movement, Index PE ratio, Index PB ratio, GDP-to-Equity ratio etc. In this article, we will understand 2 of these metrics: the Index percentage price movement and Index PE ratio and how to apply them in a simple way to get an idea of what the current market level signifies.
Index percentage price movement: If there is a big price move relative to the previous high due to a short-term sentiment-driven or temporary event-driven reason, then we can simply look at the extent of this price move to analyze whether it is a good buying opportunity. A price drop of 5% to 10% in the Nifty 50 Index from the previous high happens almost every year on an average and can be a considered as normal fluctuation. A price drop of between 10% to 20% comes once in about 3 years on an average and can be considered a good opportunity to make additional investments. A price drop of > 20% or > 30 % is even rarer, and could present a wonderful purchase opportunity, though we need to keep in mind that it may take longer to recover as compared to short-term fluctuations. Apart from the extent of the price drop, we need to evaluate whether the reason for the drop is a macro-economic one that can have a long-term impact.
Index PE ratio: We know from past data that the prices of shares have a strong correlation to the earnings growth of the companies. There are macro-economic changes - such as changes to tax laws that drive consumer behavior, changes in international trade policies, or any other changes to the business environment, that may have a long-term impact. These changes affect the earnings growth of companies either positively or negatively, which in turn have a big impact on the share prices. Consider, for example, due to some macro-economic changes that have been announced, the earnings are expected to fall by 15%. As a result of this, the Index price proportionately falls by 15%. Would we then consider this price drop as a good buying opportunity? No, because the prices have simply corrected to reflect the fall in expected earnings. Hence, in such cases, it would make more sense to look at Price-to-Earnings ratio (PE ratio) instead of the price movement in isolation.
PE ratio = Price Per share / Earnings Per ShareAbove is the formula for the PE ratio of a single stock. For an Index, the PE ratio is a weighted average of the PE ratios of all the companies constituting the Index. In our earlier example of 15% drop due to macro-economic reasons, both price (numerator) and earnings (denominator) have fallen by 15% each. In this case, the Index PE ratio would remain the same, correctly indicating no change in valuation, while the Index percentage price movement would incorrectly show it as a good buying opportunity. Thus, the Index PE ratio provides a much better idea of current valuation than the Index percentage price movement does. If the prices have dropped without a corresponding drop in earnings, then the Index PE ratio will drop and the market can be considered as relatively more attractive from a valuation perspective.
Now, looking at the absolute value of the current Index PE ratio would not make much sense. If the current Index PE ratio is at 20 or some other number, what does it mean? To determine how good the buying opportunity is by using the Index PE ratio, it would be better to see what level the current Index PE ratio is at compared to its historical average.
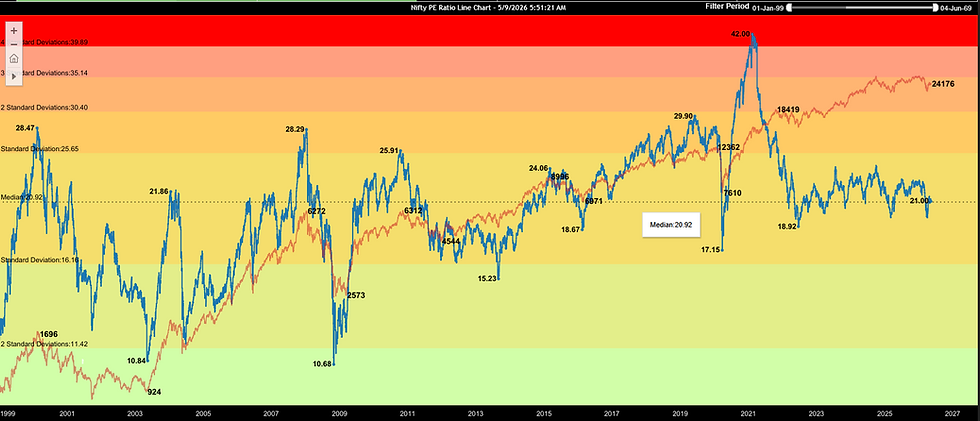
Source: https://nifty-pe-ratio.com/
The above chart from the year 2000 to 2026, shows the levels of the PE ratio of the Nifty 50 Index at a glance as indicated by the blue line. The red line indicates the Nifty price movement. The different colored ranges shown here represent different levels of the normal deviations from the historical median Nifty PE ratio of 20.92 as indicated by the dotted line in the center. So, if the current level of the Nifty PE is below 20.92 , the market can be considered as undervalued to the extent of how much the Nifty PE is below 20.92. And if the current level of the Nifty PE is above 20.92, the market can be considered as overvalued to the extent of how much the Nifty PE is above 20.92.
Having this clarity of knowing where the market level is at any point in time, will help you ignore all the confusing noise, hot tips and conflicting news flashes. Instead, you will be able to concentrate on making informed decisions for your long-term investments! So, based on the above analysis of the current level of the Nifty PE relative to historical averages in addition to other factors that may be applicable for your case, the optimum duration of STP for lumpsum investments can accordingly be planned for in consultation with a knowledgeable personal finance planner.
Is it prudent to stay on the sidelines in low-yielding investments and wait for a long and indefinite time for the best opportunity to invest in the stock market? To ponder over that, I leave you with this famous quote by Top Investor, Fund Manager and Renowned Author Peter Lynch:
Far more money has been lost by investors preparing for corrections or trying to anticipate corrections than has been lost in corrections themselves.


